Flammability Diagram
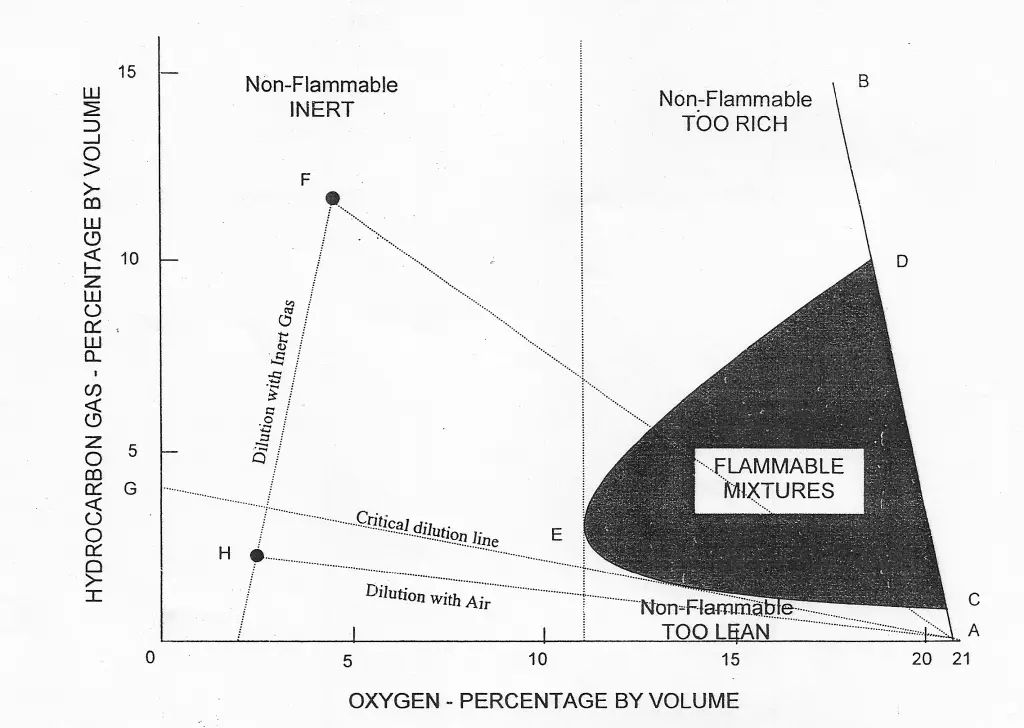
The diagram given above (Flammability Composition Diagram) can be considered the most important diagram to understand the concept of flammability.
Hydrocarbon gas normally encountered in petroleum tankers cannot burn in an atmosphere containing less than approximately 11% oxygen by volume. Accordingly, one way to provide protection against fire or explosion in the vapour space of cargo tanks is to keep the oxygen level below that figure.
The flammable limits vary for different pure hydrocarbon gases and for mixtures derived from different liquids. For practical purposes, the lower and upper flammable limits of crude oil vapours are taken to be 1% and 10% respectively by volume. These values are indicated by points C and D on the line AB in the figure.
Any point in the diagram represents mixtures of hydrocarbon gas, air and inert gas, specified in terms of hydrocarbon gas and oxygen contents. As inert gas is added to the hydrocarbon gas/air mixture, the flammable range decreases until a point, represented by E, is reached where LFL and UFL coincide. This point corresponds to an oxygen content of approximately 11%. For practical purposes and to allow a safety margin, 8% is taken as the level of oxygen at which no hydrocarbon gas/air mixture can burn under any circumstances.
To prevent fire or explosion in the tank containing hydrocarbon gas/air mixture, it is, therefore, necessary to produce and supply inert gas having an oxygen content not normally exceeding 5% and to displace the existing air in the tank until the resultant oxygen level throughout the tank does not exceed by 8% by volume.

Very informative. Thank you